
The passing week has finally (most likely) “confirmed” the assumption for a new bearish wave, which supposed to be a bearish Elliott Wave 5.
Wave 5 can sometimes be a truncated wave, which means not taking out the Low of Elliott Wave 3 preceding it. In our case it would appear as respecting the Low made on the beginning of last May, at 91.88.
But, in this case, the price action has given so far good indications to have a long bearish wave, that can reach the 87 level, mentioned here couple of times before, way below the Low of wave 3.
Another But, is that it is not going to be a slight move down, and currently we are in an area of strong support, right where the price broke up due to the Brexit poll results. When the price runs away sharply from a certain point without testing it back, you can be sure that many orders remained unfulfilled at the same level, and once the price reaches back the same area, certainly for the first time ever since, you should expect massive buying at this area, in other words, a support. (Of course the same goes as well for the opposite side).
We are currently in a bearish setup to reach the area of 93.5, while the current stop level is above August’s High so far, 96.5. All the area from the close of Jun 23rd at 93.527 with an open gap till 93.73 (the Brexit news) and up to till current price level – is a clear support and we should see corrective rallies being initiated from these levels, at least on the Daily timeframe before the expected bull capitulation finally.
For this bearish wave to develop, the market should not reach again the last Weekly correction up’s High which is the High of August so far, at 96.5.
Taking out the passing week’s High at 95.77 and closing above it is a clear sign of strength that may turn the above bearish assumption to be very doubtful.
On the other hand, any Daily attempt to recover up -that ends up as a sign of weakness, e.g. a bearish pinbar – is a good signal to take at least till closing the open gap below (knowing that there should be some bounce after it) once proceeding with a thrust down on the next day.
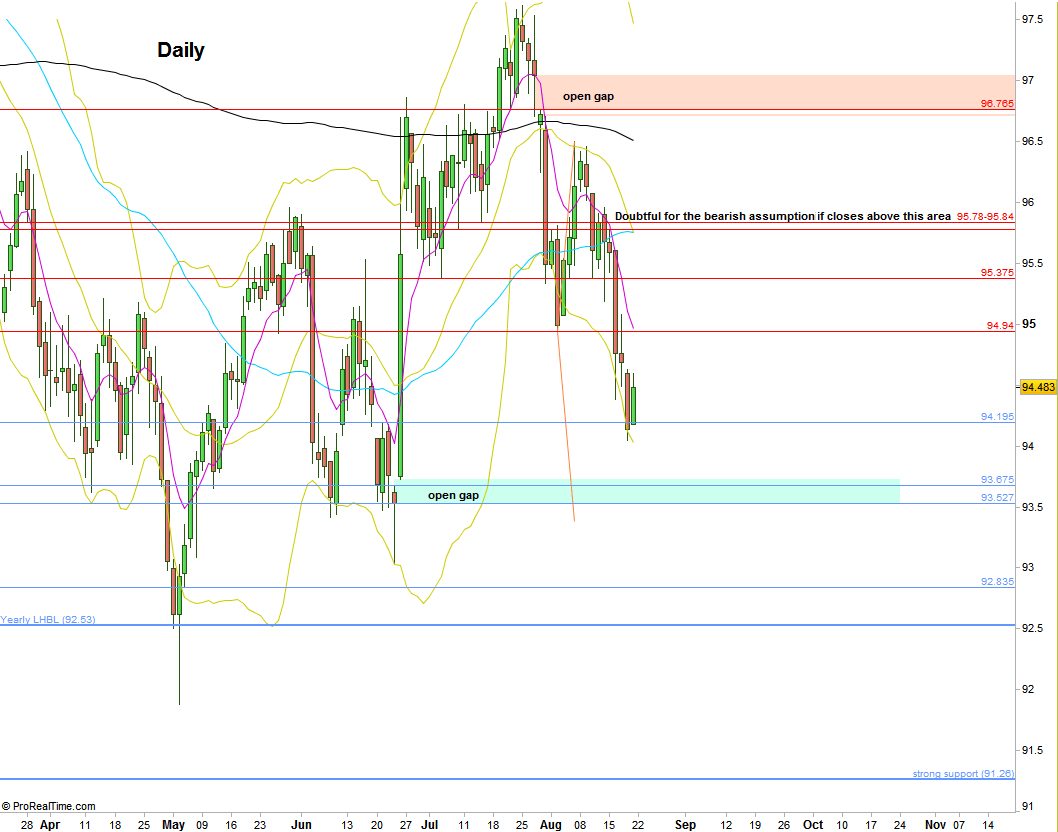
Dollar Index, Daily chart with most important Support and Resistance levels (at the courtesy of prorealtime.com)
Disclaimer: Anyone who takes action by this article does it at his own risk and understanding, and the writer won’t have any liability for any damages caused by this action.