
After the volatile price action in the previous week, in the passing week the market was much calmer trading in a relatively small range, having some support.
The market is currently in a bullish setup on the Daily to reach 97.96. Indeed, it is expected to see some rally in the coming week that closes the month, and some struggle on the Monthly 20 SMA, currently at 97.99.
It is very important to watch where the market is going to close the Monthly bar at the coming Wednesday. If the Monthly bar closes above the Monthly 20 SMA (i.e. 98 and above), it would be a sign of strength, meaning that the next decline would probably be climactic – meaning returning eventually into a midterm bullish sentiment.
To remind us, the market is pointing currently on 96.12 as a target for the midterm bearish move. The reasons are two: the Follow Through bearish model described many times at past reviews, and the potential AB=CD harmonic pattern, both pointing at 96.12 as their target.
Closing the Monthly bar below the 20 SMA might imply that the 96.12 is not the end of the bearish story, and in the best case for the bulls meaning more sideways and consolidation actions at these levels.
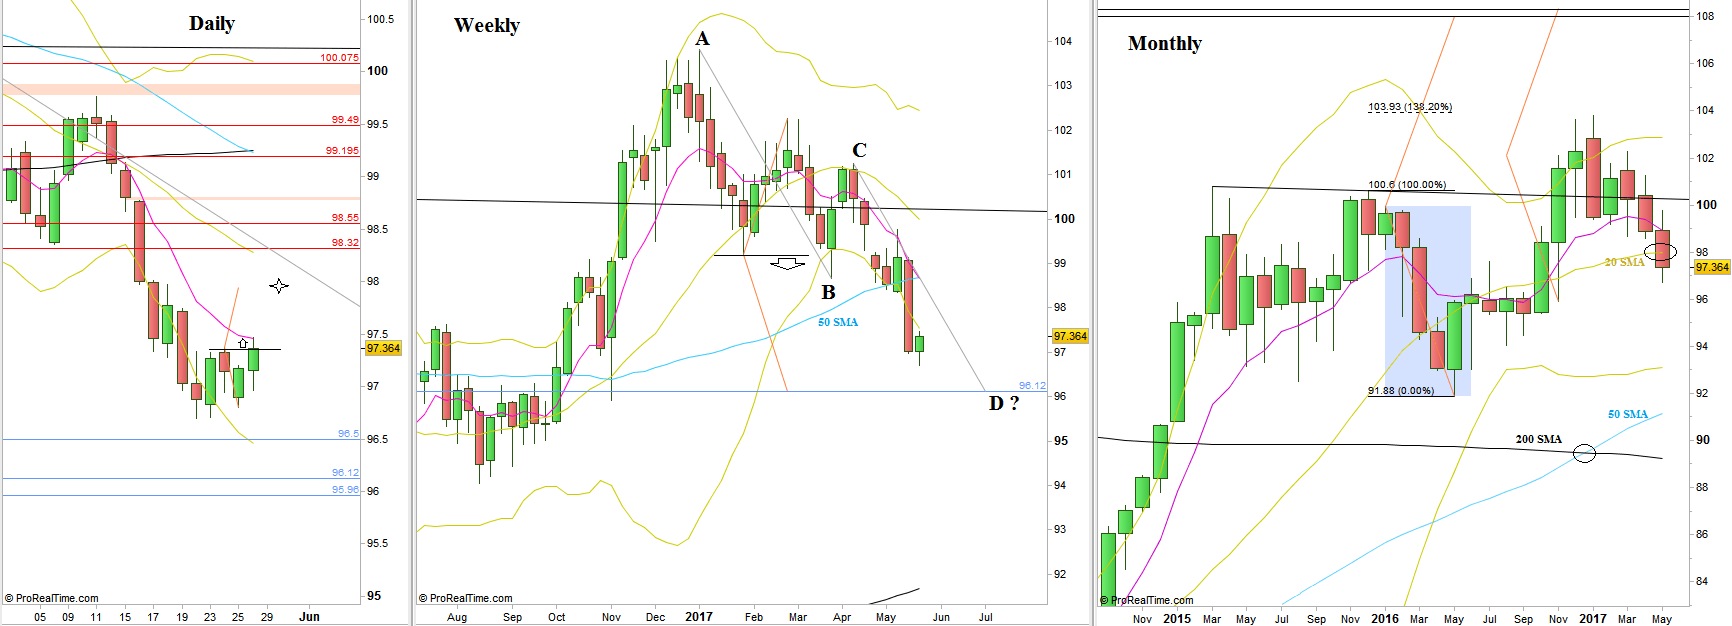
Dollar Index: Daily, Weekly and Monthly charts (at the courtesy of prorealtime.com)
Disclaimer: Anyone who takes action by this article does it at his own risk and understanding, and the writer won’t have any liability for any damages caused by this action.