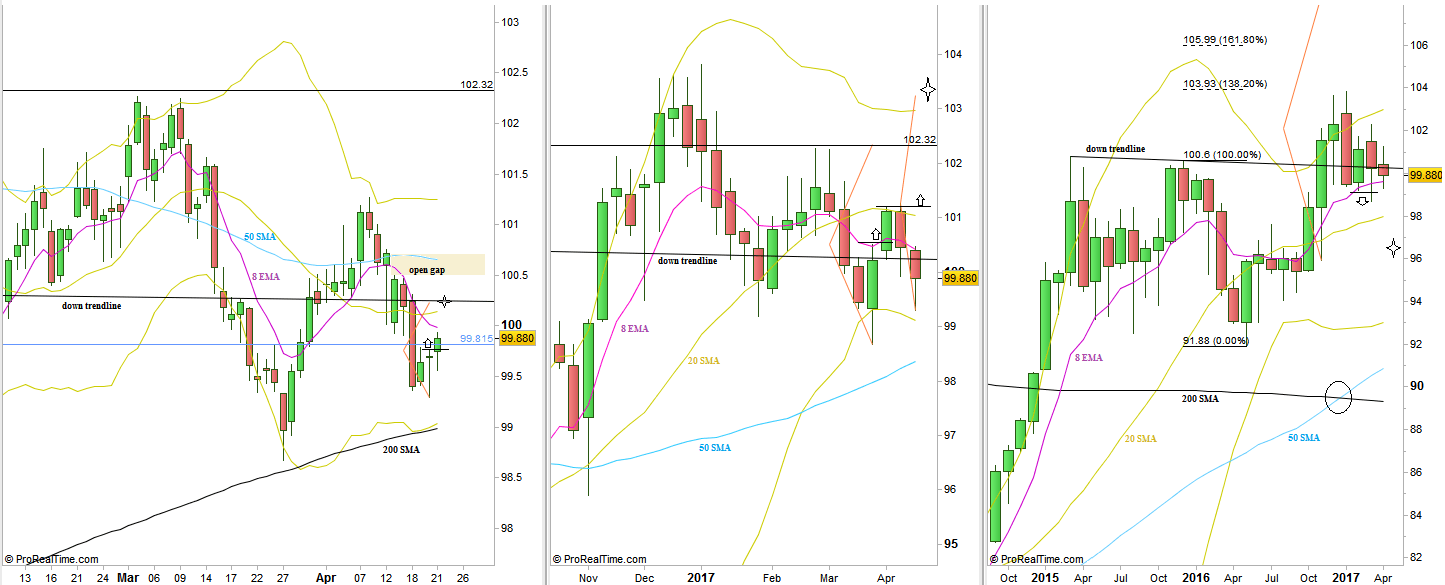
After the bearish reversal on the week before, came a bearish week, but revealing lack of a thrust down. The Weekly bar couldn’t make it to the lower Bollinger band, a clear sign of strength.
Last Thursday the market made a Spring(=false thrust down turning into a bullish reversal), already got a confirmation thrust up on last Friday. The target for this setup is at the Open of Tuesday (~100.24), the most bearish day over the last week. This level is at the famous down trendline the Dollar Index has been dealing with for the last year.
As mentioned in the past reviews, there are two opposite indications for the Dollar Index for the midterm. One is closing the Quarter bearishly on the down trendline, plus a bearish setup on the Monthly timeframe to reach the 96.15 area. The other is the Weekly Spring rejecting the Weekly bearish setup since the beginning of year 2017, forming a bullish setup to reach the Monthly High at 102.27, -still in play as the Low of that Spring (which is the Monthly Low at 98.67) has been respected so far.
Without the coming news from France that can cause serious volatility, the price action of the Dollar Index could remain the small range Monthly inside bar as it is right now before the week starts, whereas closing above of bellow the down trendline, and the Monthly 8 EMA could give more indications as for the future midterm direction of the market.
Taking out the Weekly High at 100.465 on this coming week is a bullish setup, to reach the current Month’s High at 101.265, depending on how the market deals with the open gap above(100.5-100.711). Taking out the Weekly Swing High at 101.265 is a bullish setup to reach the level of 103.25, very closed to the Quarterly High.
Disclaimer: Anyone who takes action by this article does it at his own risk and understanding, and the writer won’t have any liability for any damages caused by this action.

