
The Dollar index has ended the passing week with an upthrust (false thrust up), and a thrust down. The Monthly bar of January ended as a bearish engulfing bar, but pay attention that it has penetrated deeply the upper Bollinger band, and did it after 2 successive penetrations before. So for the midterm the picture is not bearish, at least not yet, and we need to see some bounce to test the High again, a move that in case is failed then it is bearish for the midterm.
As mentioned in the last review, a thrust up above the Weekly High of the previous Weekly bullish pinbar could be misleading, and we needed another pullback and a follow through in order to join the bull side, but that didn’t happen, and instead the market printed an upthrust. In this case, the Daily bar of last Monday gave a good bearish setup, it was a bearish pinbar on sloping 8 EMA, followed by the trigger – a thrust down the next day – to go short for the same amplitude target (almost achieved).
Currently we have the same bearish potential setup – a bearish Daily pinbar on sloping 8 EMA printed last Friday. A thrust below this bar is the trigger to go short for the same amplitude down, i.e. 98.7 and even below, but pay attention that the whole current area is a clear support area, so it might be somewhat a misleading move eventually. A very clear Monthly support lies also at 98.3, and at 97.6
A thrust down below the Weekly Low is a bearish setup to reach the 97.6 area where the Monthly 20 SMA and the Weekly 200 SMA currently lie. Pay attention that there is an open gap below the Weekly Low, and it is better to wait for a bounce after it is closed entering on new signs of weakness.
On the other hand, respecting the Low of last Friday and a making a thrust up above its High probably means that a Weekly correction has begun, before the next attempt to drill down might come.
On the Quarterly level, we are testing back (from above) the most important down trend line for the past two years, and a bounce from this level, or the target for the potential Daily bearish setup mentioned above (currently not more than a corrective bounce up) is most likely to appear.
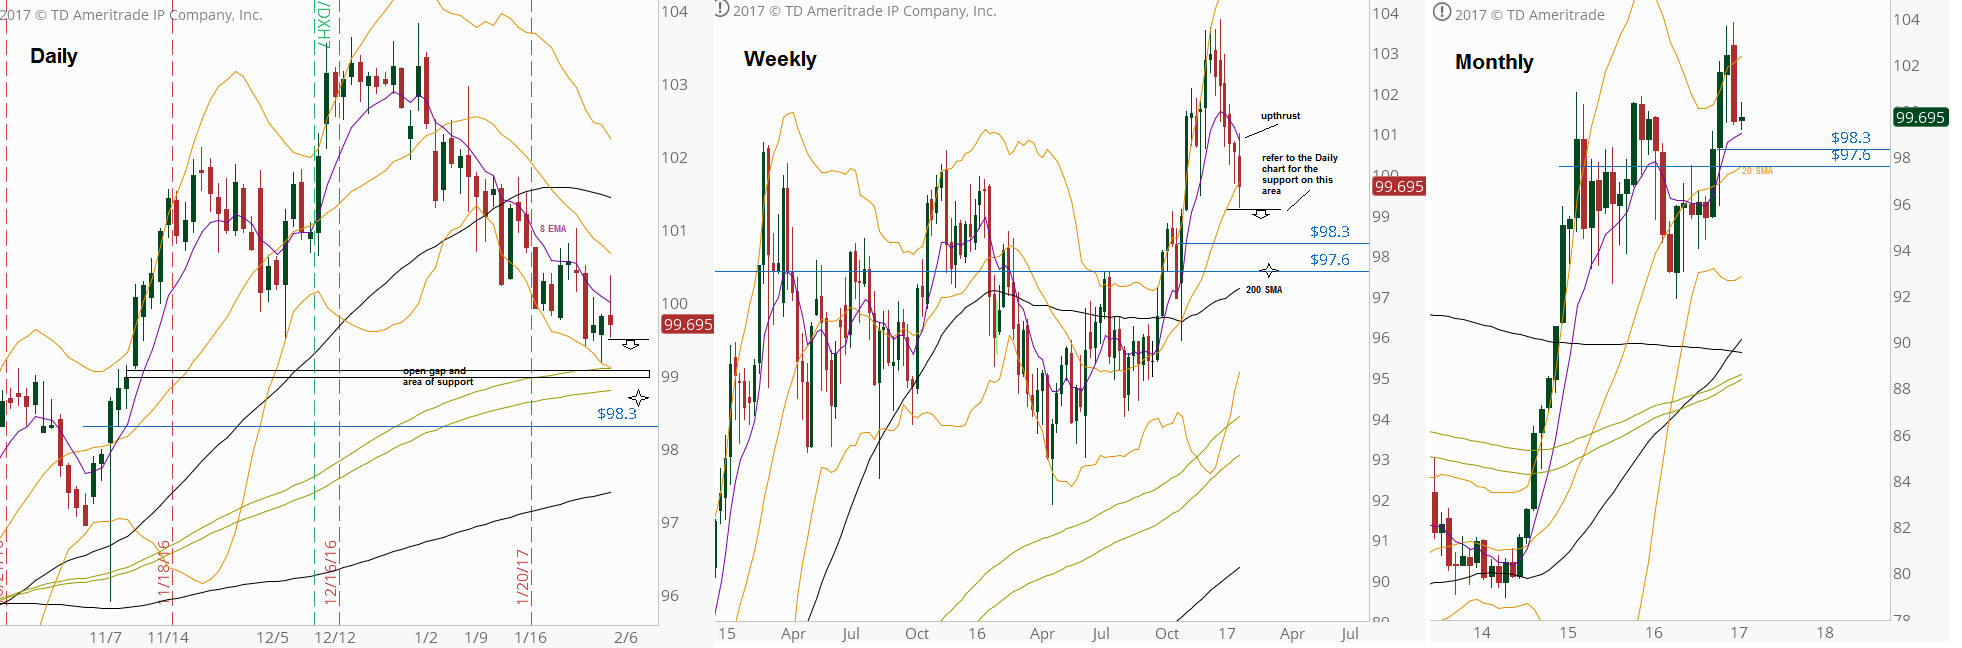
Dollar Index, Daily Weekly and Monthly charts (at the courtesy of thinkorswim.com)
Disclaimer: Anyone who takes action by this article does it at his own risk and understanding, and the writer won’t have any liability for any damages caused by this action.