
Finally, the Dollar Index did reach the level of 98.68, the target of the bullish signal triggered on the Brexit spike, initiated by taking out the High of 95.96.
The signal to go long above the Weekly High mentioned here last week, although retraced quite deeply towards the stop level, has eventually reversed up to make the expected 1:1 amplitude target move.
The current levels are going to be challenging for the Dollar Index, and from the price action point of view, if it is truly bullish midterm, it is less likely to take out the Yearly High before this year ends. There is currently nothing to look for into the bearish side for the coming week – even weeks, the market is very strong, and it would be surprising to see it getting weaker for more than a consolidation at these levels.
Currently the most important bullish sign is the Quarterly bullish pinbar on a sloping 8 EMA pointing up, but it is important to understand the limited context of it, as it is an inner bar in the Quarterly chart.
The most important resistance is at the levels of 99.20-99.36, and by price action it is less likely to see the price overcomes this area without any reaction. Pay attention that the level of 99.2 is the Semiannual upper Bollinger band, which happens to be currently the Daily upper band level as well (sure the former one is by far much more important).
If the price does overcome this resistance of 99.20-99.36, it means that the High of 99.95 is very likely going to be taken out as well, and the market is probably going to the upper down trendline taken by connecting the Highs of March 2015 and December 2015, right at the upper Bollinger band on the Monthly timeframe, at 100.30.
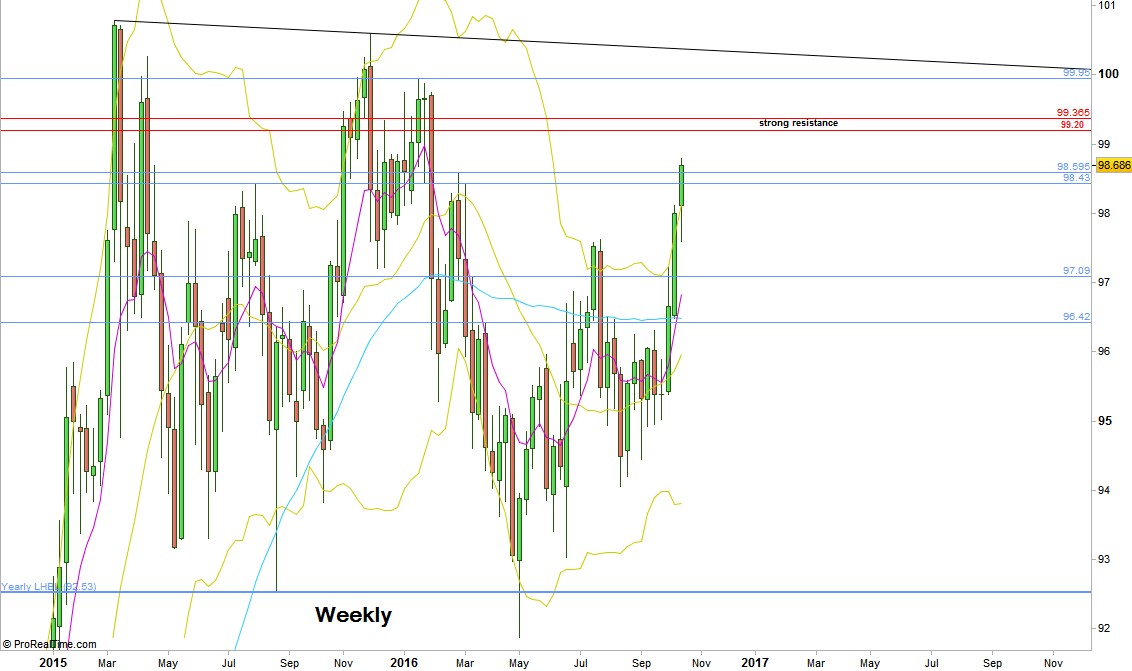
Dollar Index, Weekly chart (at the courtesy of prorealtime.com)
Disclaimer: Anyone who takes action by this article does it at his own risk and understanding, and the writer won’t have any liability for any damages caused by this action.