
It took only one day of inside bar consolidation (last Monday) before the Weekly High was taken out, drifting the price to take out the July’s High at 97.62 as well.
Taking out the High of 97.62 triggers a bullish signal with a target above the Yearly range (above 100.785). I’d be very doubt to see this move taking place in the current year, as the yearly price action suggest that the major bullish wave should most likely continue not before the end of 2016.
The realistic target currently is the bullish signal to reach the 98.68 level – triggered on the Brexit spike (by taking out the High of 95.96). From the price action point of view, there is a good chance to reach this target before the month of October ends. An important Fibonacci retracement level lies right above that target, the 78.6% retracement level at 98.73, since the major decline that started at December 2015.
Currently there is no point to look for a bearish opportunity, as for such scenario we need at least an inside bearish Weekly bar as a contra bar for the current bullish momentum.
On the other side, there is currently a clear trigger to go long – above the last attempt down made last Thursday, – in other words, buy a new Weekly High. The target is the same target mentioned above, 98.68-98-72. Resistance levels on the way up lie mostly at 98.415-98.5.
Above that target level there is a very clear and strong resistance at 99.25-99.35, and 99.7-99.755.
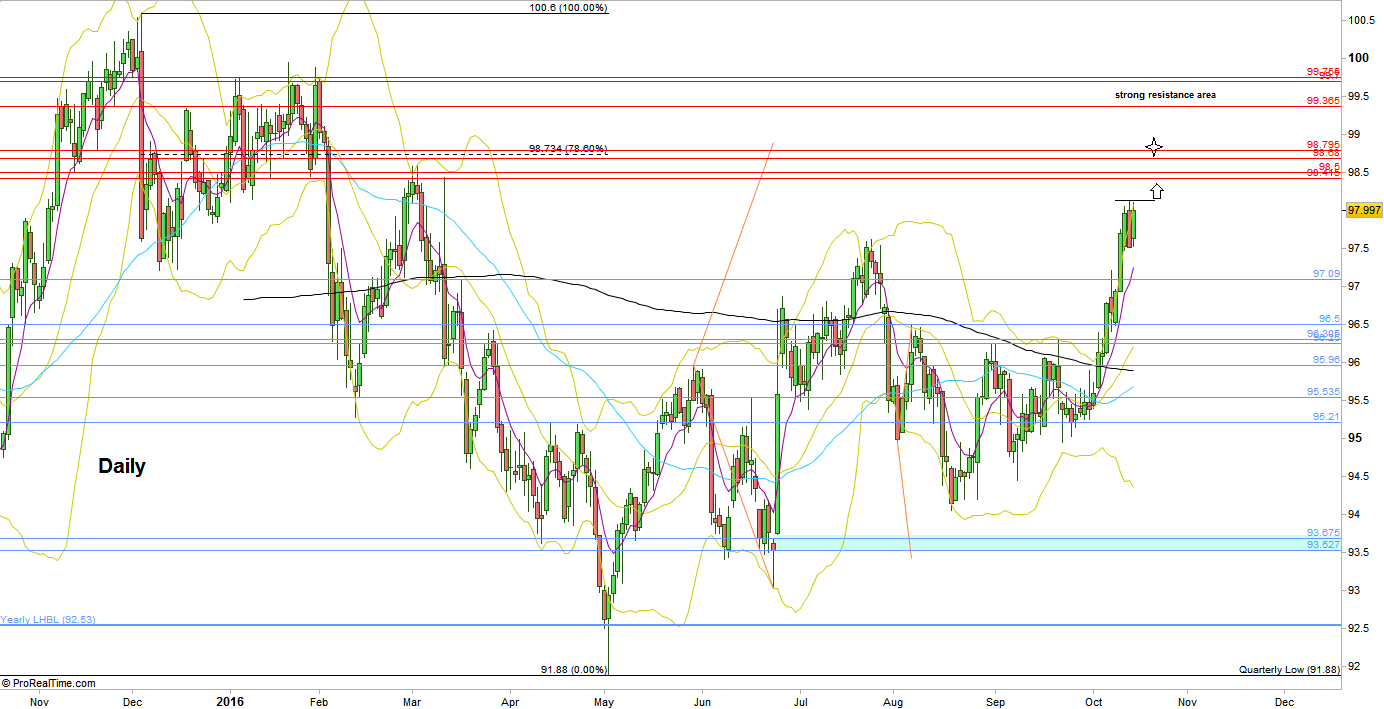
Dollar Index, Daily chart (at the courtesy of prorealtime.com)
Disclaimer: Anyone who takes action by this article does it at his own risk and understanding, and the writer won’t have any liability for any damages caused by this action.