
After couple of weeks of smart distribution, and a manipulation of an upthrust (false thrust up), finally the expected supply has shown up throughout the passing week printing a considerable big range bearish bar. By most chances a new bearish midterm wave, that may reach the level of 87 eventually, has probably already begun.
The Weekly bar took out the LLBH of 95.375, closing below the 8 EMA short term sentiment line, a bearish picture.
The coming week can be another LL LH week with a probable shortening of the thrust, but it can be an inside weekly bar that even looks quite bullish by building a right shoulder of a possible Head & Shoulders pattern on the Daily timeframe. Still, whether it is going to be this coming week or the next one, we should expect a week of correction up before continuing most of the decline.
An important indication or confirmation for the above bearish wave assumption should be to watch whether the Daily bars respect the above Daily 200 SMA barrier by not closing above it. The Weekly bar shouldn’t close above the Weekly 50 SMA.
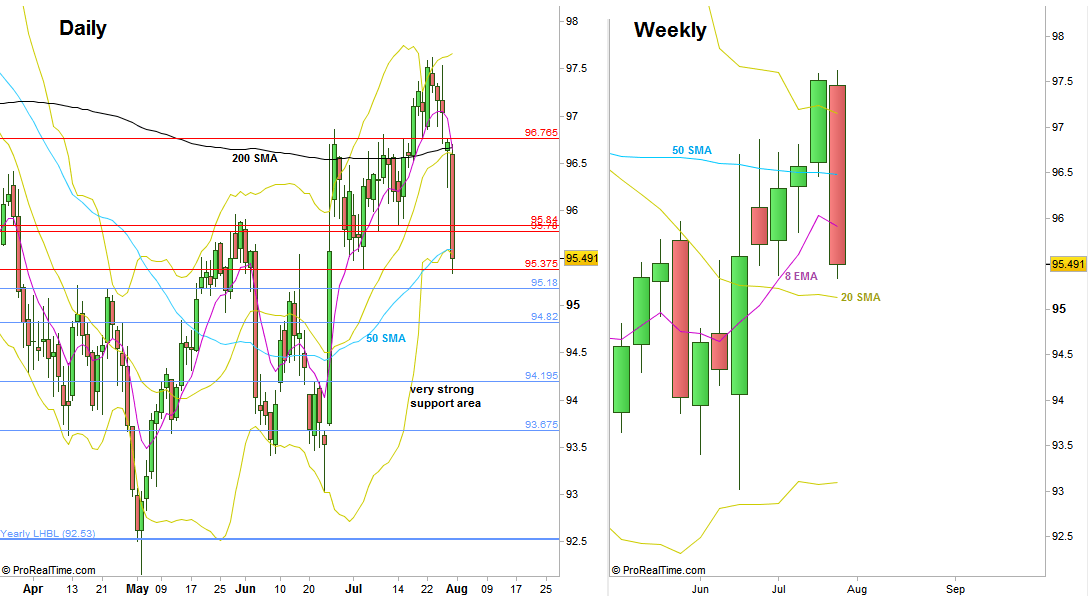
Dollar Index, Daily and Weekly charts (at the courtesy of prorealtime.com)
Disclaimer: Anyone who takes action by this article does it at his own risk and understanding, and the writer won’t have any liability for any damages caused by this action.