
Dollar Index Update : 12 Aug 2021
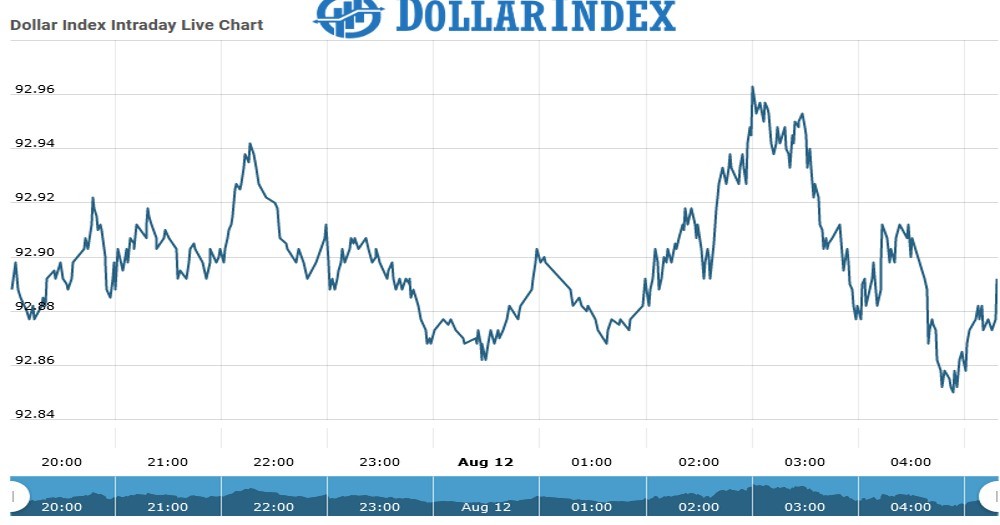
The U.S.Dollar Index is trading at 92.86 with a loss of -0.07% percent or -0.07 point.The Dow Futures is trading at 35,513.20 up with +0.08% percent or +28.20 point.The S&P 500 Futures is trading at 4,447.00 with a loss of -0.02% percent or -0.70 point.The Nasdaq Futures is trading at 15,009.10 with a loss of -0.12% percent or -18.70 point.
TODAY’S FACTORS AND EVENTS
The dollar held near a four-month peak against major peers on Thursday after retreating overnight as a cooling in consumer inflation tempered bets for an earlier tightening of U.S. monetary policy.
PREVIOUS DAY ACTIVITY
For the day the Dow is trading at 35,101.85 with a loss of – percent or ?106.66 point. The S&P 500 is trading at 4,432.35 with a loss of – percent or –4.17 point. The Nasdaq Composite is trading at 14,860.18 up with
WORLD MARKETS
Other leading market index closes included the small-cap Russell 2000 Index closed at 2,250.34 up with +0.49% percent or +10.98 point. the S&P 600 Small-Cap Index closed at 1,366.76 up with +0.71% percent or 9.65 point. the S&P 400 Mid-Cap Index closed at 2,741.91 up with + percent or +22.60 point. the S&P 100 Index closed at 2,035.51 up with + percent or +3.56 point.the Russell 3000 Index closed at 2,640.12 up with + percent or +6.04 point. the Russell 1000 Index closed at 2,495.92 up with + or +5.27 point.