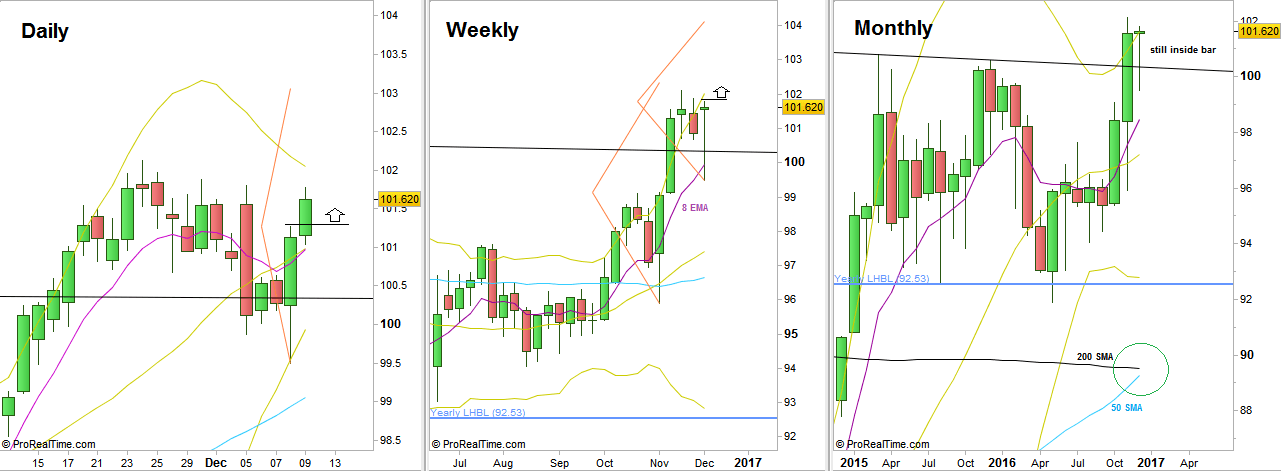
We’ve passed one of the more volatile weeks. Prices declined sharply on last Monday after making an Upthrust, then after two days of consolidation came a major Spring (false thrust down ending very bullish) pushing the prices back to the levels of the beginning of the week, creating a Weekly bullish pinbar on sloping Weekly 8 EMA, relatively strong.
Interestingly, the Daily bearish setup mentioned in the last review has reached its full target of 99.6, but it wasn’t a quality signal backing clear bullish momentum on the higher timeframes.
For a rapid bullish continuation we need to see the Weekly High taken out. A thrust above the Weekly High at 101.8 is a bullish trigger to reach the same magnitude of the Weekly pinbar’s range, slightly above 104.
Pay attention that there is already a Daily bullish to reach the 103 level by taking out the High of the Spring made on last Thursday (false thrust down, touching and rejecting the lower Bollinger Band)
However, beware of two signs of weakness that might develop the coming week. First, the bullish thrust of last Thursday and Friday didn’t manage to take out the Monday’s High at 101.8 which is the LHBL (Last High Before Low). That’s still OK as long as the Low of Friday is respected. The second is that the Weekly bar didn’t touch the upper Bollinger band (after 9 Weekly bars that did). Again, a thrust up above the Weekly High is a clear bullish sign, but any Daily reversal down without taking out the Weekly High, is a clear alert for a weakness.
Disclaimer: Anyone who takes action by this article does it at his own risk and understanding, and the writer won’t have any liability for any damages caused by this action.

