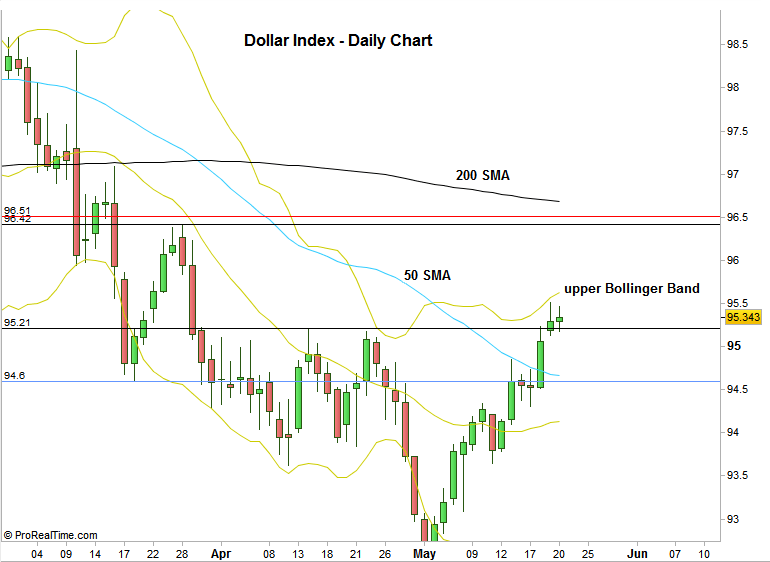
On the last weekly review, we mentioned the 95.21 (the high made at 14-APR-2016) level as an important bullish barrier level, and the market did take out that level – which means increasing chances to get back into the mid range ~ 96.5 (at least in the mid term).
The scenario for the continuation of the bullish move up suggested on the last review -did take place at the passing week.
Since last Thursday, the Dollar Index has been dealing with the 95.28 resistance level and the 95.54 level in which the Monthly 20 SMA is currently being located. Pay attention to the shortening of the thrust and to an important sign of weakness on the Daily timeframe. After the last high momentum move up sharply towards the upper Bollinger Band, In order to continue the strength, it is expected to see the Daily bars touch and penetrate the upper band. But the last two days ended as a small range bars that didn’t touch the upper band.
Further signs of weakness at the beginning of the coming week might start a weekly correction of at least one Weekly bar. Pay attention to the small support levels at 95.1, 94.98, 94.82 and the strongest near support at 94.57-94.60 in which the Daily 50 SMA is going to be located.
On the other hand, new signs of strength at the current area (less expected at the moment) should continue the bullish momentum towards the 96 (Weekly 20 SMA) and 96.42 (might be taken out – the strongest resistance is at 96.5, the mid big range as mentioned above), where the Daily 200 SMA and the Weekly 50 SMA are going to be located.
Here is the Daily Chart. Please ignore the Open gap seen below the last two daily bars, as the contract did traded at these prices.
Disclaimer: Anyone who takes action by this article does it at his own risk and understanding, and the writer won’t have any liability for any damages caused by this action.

