
After the Bullish Key reversal over the considerable support mentioned in previous reviews (testing from above the 92.53 Yearly Last High Before Low), last week was a bullish continuation, but with shortening of the thrust.
The most important level to reach as for the bull side is the 14-ARP-2016’s High at 95.21.
There is a good scenario that can emerge that might lead to taking out this level: Staying in the range of last Friday for at least one more day, then taking out the high of Friday can kick the price to take out the 95.21 level.
Strong resistance that might force a weekly correction is very near: at 95.28
On the other hand, signs of weakness for one to two weeks of consolidation can appear here as well, causing the price to test again the level of 92.53 or slightly above (93.06). A good scenario for this to emerge can start by taking out last Friday’s low reaching the daily mid Bollinger Bands (20 SMA), then a bounce up. At that point breaking down again the Low created can lead to challenging the Weekly Low at 93.65. Another bounce up followed by further signs of weakness can take the price down to 93.06.
So, the above two cases means that weekly consolidation is most likely to happen, the question is whether before taking out the 95.21 level, or after. I would give much less chances to the scenario of going rapidly up to the mid monthly range at 96.51.
A sketch of the two scenarios mentioned with the possible trades is attached to the Daily chart. (Remember though that the market can yield endless variations…)
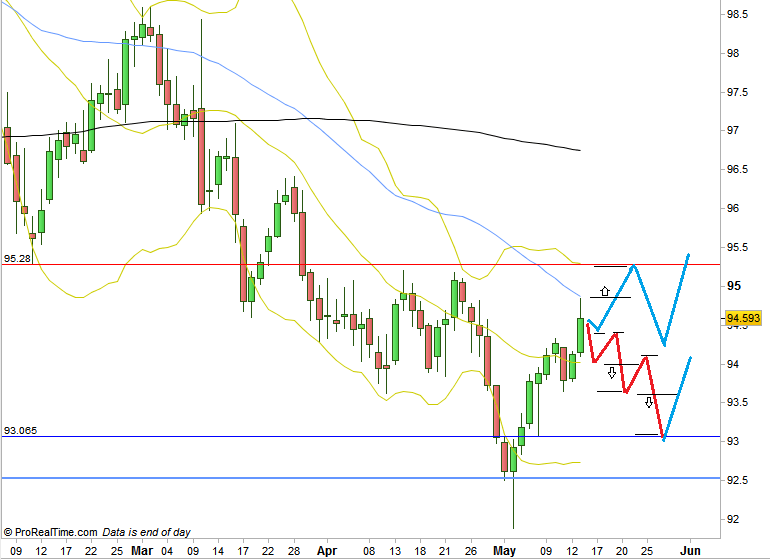
Dollar Index Daily chart with the two scenarios mentioned (at the courtesy of prorealtime.com)
Disclaimer: Anyone who takes action by this article does it at his own risk and understanding, and the writer won’t have any liability for any damages caused by this action.