
Talking Points:
- US Dollar Slowly Inching to Challenge Key Range Bottom
- S&P 500 Renews Upside Push, Sets Another Record High
- Gold 3-Month Support at Risk, Crude Oil Digesting Gains
Can’t access the Dow Jones FXCM US Dollar Index? Try the USD basket on Mirror Trader. **
US DOLLAR TECHNICAL ANALYSIS – Prices may have finally started to turn lower as expected following the appearance of a bearish Evening Star candlestick pattern. Near-term support is at 11740, the 14.6% Fibonacci retracement, with a break below that on a daily closing basis exposing the 23.6% level at 11653. Alternatively, a reversal above the 11854-76 zone (14.6% Fib expansion, March 2009 high) opens the door for a challenge of the 23.6% expansion at 11963.
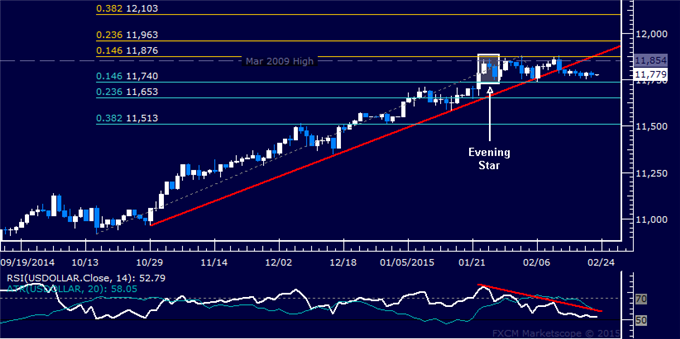
Daily Chart – Created Using FXCM Marketscope
** The Dow Jones FXCM US Dollar Index and the Mirror Trader USD basket are not the same product.
S&P 500 TECHNICAL ANALYSIS – Prices resumed their ascent after a brief period of consolidation, establishing a new record high. A daily close above the 23.6% Fibonacci expansion at 2113.60 exposes the 38.2% level at 2131.30. Alternatively, a reversal below the 14.6% Fib at 2102.60 targets the February 20 low at 2084.90.
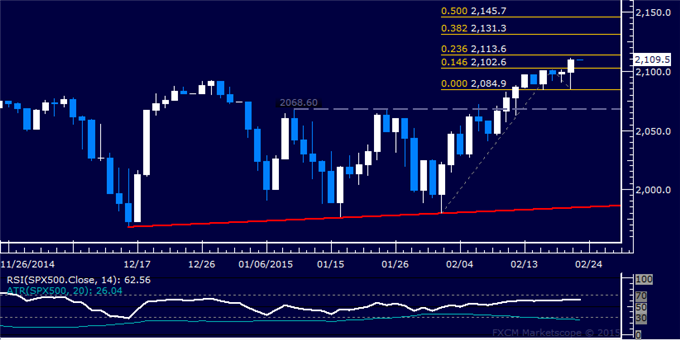
Daily Chart – Created Using FXCM Marketscope
GOLD TECHNICAL ANALYSIS – Prices challenging pivotal support at 1197.86, marked by the intersection of a channel floor, a rising trend line and the 61.8% Fibonacci retracement. A break below this barrier exposes channel floor support at 1180.93, followed by the 76.4% level at 1171.96. Alternatively, a reversal above the intersection of channel top resistance and the 50% Fib at 1218.80 targets the 38.2% retracement at 1239.73.
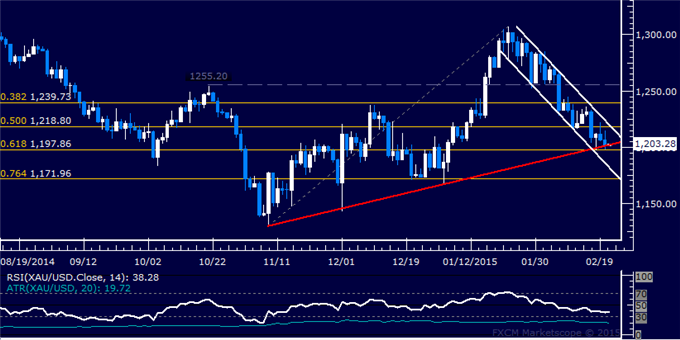
Daily Chart – Created Using FXCM Marketscope
CRUDE OIL TECHNICAL ANALYSIS – Prices are digesting gains below the $ 64/barrel figure after reversing upward as expected. A break above the 50% Fibonacci retracement at 63.38 on a daily closing basis exposes the 61.8% level at 67.68. Alternatively, a reversal below the 38.2% Fib at 59.08 targets the 23.6% retracement at 53.77.
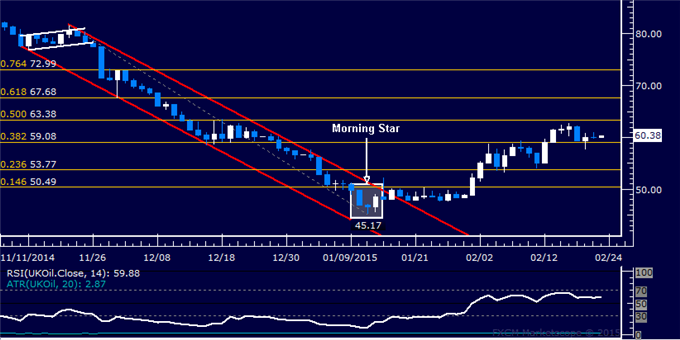
Daily Chart – Created Using FXCM Marketscope
— Written by Ilya Spivak, Currency Strategist for DailyFX.com
To receive Ilya’s analysis directly via email, please SIGN UP HERE
Contact and follow Ilya on Twitter: @IlyaSpivak