
The first week of the year 2017 ended with a shakeout on both directions. The market has made a new Weekly High first, declining back to take out the Weekly Low. The Dollar Index continues to crawl up on the higher timeframes.
The current pattern on the Daily is a megaphone pattern (Taking out Highs and Lows successively). In such a pattern, is it important to pay attention to the price action on the mid range, as most likely any new High or Low is followed by testing the mid range once again. A reversal on the mid range can probably indicate as for the intention of the market.
The most important bullish indication around is the Weekly bullish pinbar on sloping 8 EMA, 5 weeks ago, target at 104.1 and the 138.2% extension of the bearish wave since March 2015, at 104.19. Both do not reject the current Megaphone pattern and in case the price gets there and reverses, it is very likely to watch it going back into the middle level of the range (where it currently stays).
As mentioned last week, the Yearly bar closed as a bullish pinbar on sloping 8 EMA, very powerful pattern when its High is taken out, which it did right at the first week of the current year. The long term target for this pattern is the 105.5 level (while the Stop is huge as well, below the Yearly Low at 91.88).
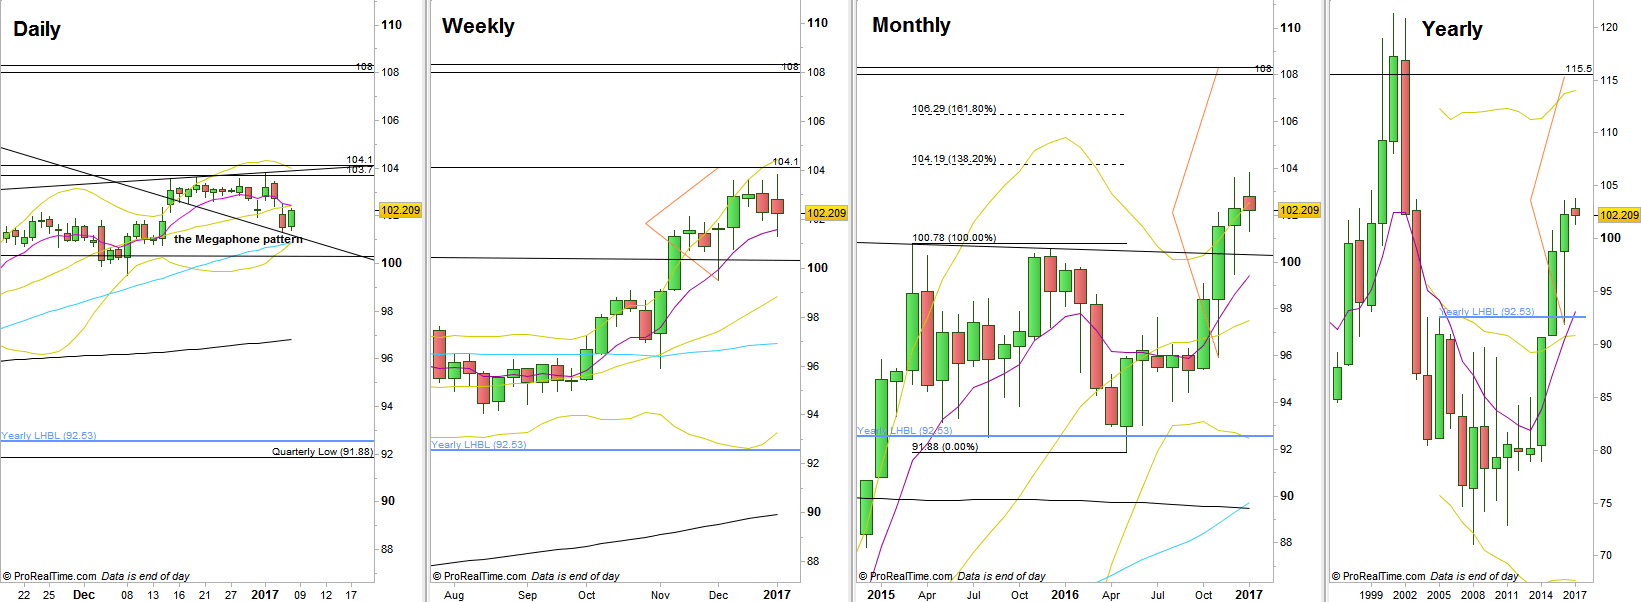
Dollar Index, Daily, Weekly, Monthly and Yearly charts (at the courtesy of prorealtime.com)
Disclaimer: Anyone who takes action by this article does it at his own risk and understanding, and the writer won’t have any liability for any damages caused by this action.