
Like the main stock markets, the Dollar Index ended the year 2016 with a minor retracement week. It was the first Weekly bar not to touch the upper Bollinger band, after 12 (!) successive weeks. The prices declined finally into the open gap on the Daily timeframe, below.
The Daily bullish setup mentioned in the last review has almost reached its target, but reversed finally and failed.
Currently, the thrust down below the Low of the Weekly Doji two weeks ago, is pointing towards the 101.4 level as its target, but this is the first counter trend signal and may fail. Also, notice the remaining open gap 101.77 till 101.95, which closing it is another target for a bearish setup on the Daily timeframe (therefore many chances to see some short covering right after).
The Yearly bar closed as a bullish pinbar on sloping 8 EMA, very powerful pattern in case the High is taken out in the year 2017.
The next major target above is the Weekly pinbar of the first week of December, pointing at 104.1 as its target, very closed to the 138.2% extension of the bearish wave since March 2015, at 104.19.
Higher target is the 108 level which is the target for the Semiannual bullish pinbar of the first half of 2016. The Monthly bar of last November that includes the election reaction is pointing towards the same level, around 108.
Happy New Year!
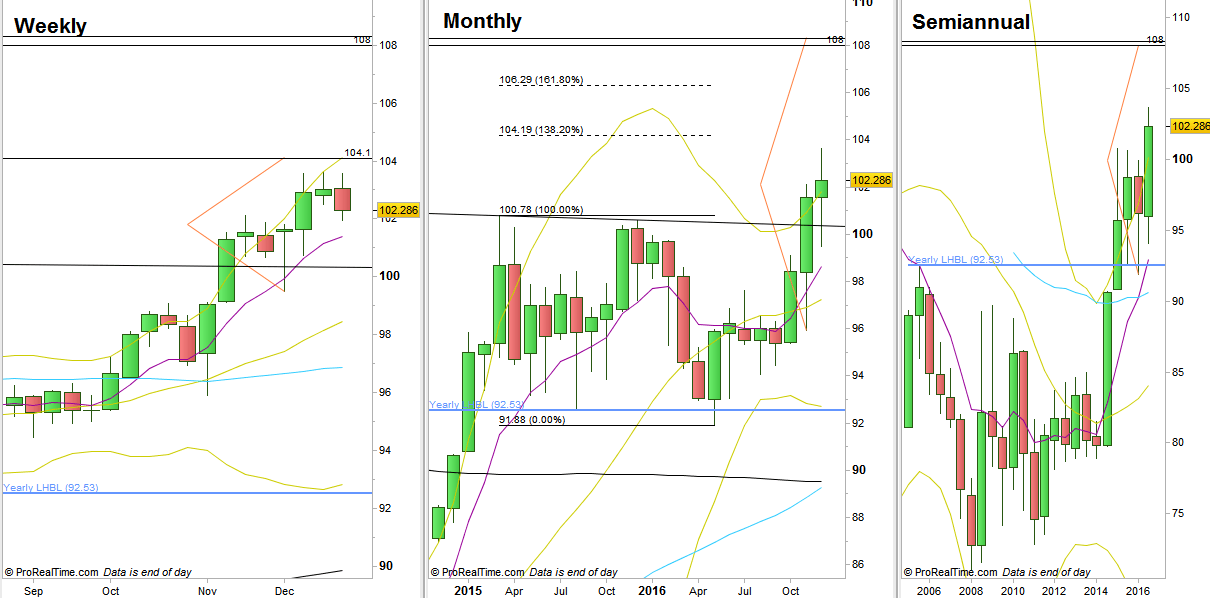
Dollar Index, Weekly, Monthly and Semiannual charts (at the courtesy of prorealtime.com)
Disclaimer: Anyone who takes action by this article does it at his own risk and understanding, and the writer won’t have any liability for any damages caused by this action.