
Finally, the Dollar index has found its path to get into the mid Quarterly range, after two misleading moves, the latter one took place on Friday, where the market negated immediately the bearish setup, and skyrocketed to take out the high of 96.42 mentioned couple of times in the previous reviews, reaching the level of 96.7 by puncturing the Daily 200 SMA and Weekly 50 SMA, finally closing the week fairly weaker.
Currently there is a bullish setup to reach the 98.7 area with a SL below the Weekly Low, but I would not give it much chance at the moment, at least not before we see how the Monthly and Quarterly bars are closed on the coming Thursday. The Monthly bar, although confirming (by making a HH) the bullish engulfing pattern of the month of May, is currently below the Monthly short term sentiment 8 EMA Line. Closing the Monthly bar on the current level would be bearish.
Starting the Week bullishly near the current level, and Taking out the Weekly High at 96.7 is a bullish setup aiming towards the Weekly upper Bollinger Band, at 97.6. However, there is an important resistance is at the 97.10 level. An inability of the market to pass that point, followed by a daily thrust down is an important sign of weakness that might end this correction up started since the 3rd of May.
Generally, signs of Weakness by the Weekly (!) timeframe at the current area might turn into another midterm bearish wave (Elliott wave 5, see the Weekly chart), this time most likely towards the 87 level.
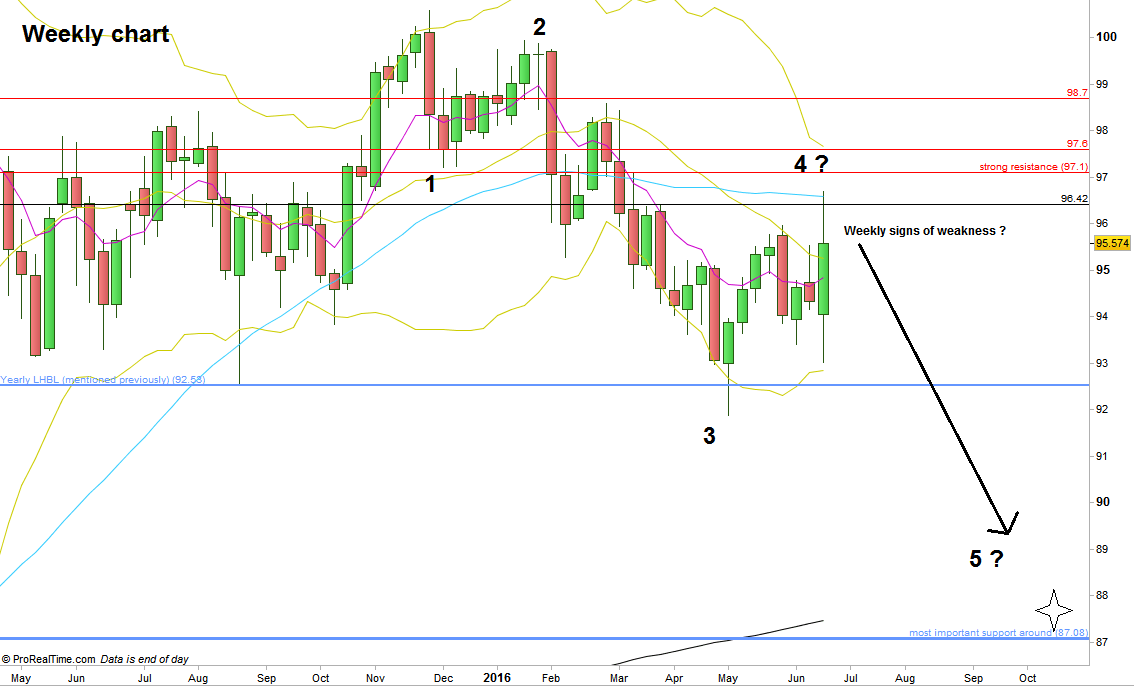
Dollar Index, Weekly chart with a possible Elliott wave count (at the courtesy of prorealtime.com)
Disclaimer: Anyone who takes action by this article does it at his own risk and understanding, and the writer won’t have any liability for any damages caused by this action.