

USDX, the index that comprises the main currencies rates relative to the USD has been in a wide range since MAR 2015, after a remarkable bullish momentum that started at JUN 2014.
Let’s have a long term look first by chart1, the Yearly chart (each bar is one year).
On the longer term, the current bullish market of the USDX should be considered so far as a major correction in a big bearish market. If we look for sign on strength, we see that the most important high throughout the whole years 2001-2008 decline – has been taken out, marked as a yearly major LHBL (Last High Before Low). The professional eye might be interested at the remarkable high volume (the year 2015’s bar). But, since the bullish momentum was halted already in MAR 2015, although the price managed to close the whole year close to the top, this volume includes also bearish forces that caused the stopping action within the year 2015.
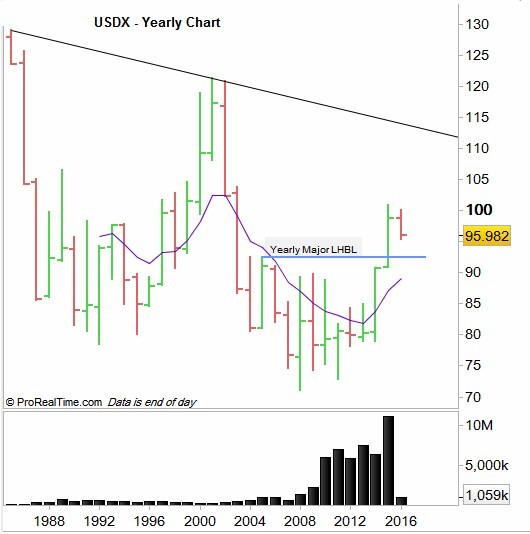
US Dollar Index (USDX) Yearly Chart
Chart1: USDX in a yearly timeframe
On the weekly chart (Chart2), the whole range since MAR2015 is seen very clearly. Notice how the lowest point in the range so far is the same Yearly LHBL mentioned in the Yearly chart (the blue line).
Looking for a sign of strength inside the range, we can notice that the most important high (mentioned here as the Quarterly Major Last High Before Low) – has been taken out on NOV 2015, – but a shortening of the thrust on the way up caused eventually a big high volume bearish bar by the last week of NOV 2015, and a follow thru attempt failed to make a Higher High, starting a big drop 2 weeks ago.
For the short term, expect the current bearish momentum to reach 94.5 at least, whereas taking out the low of the range (The yearly Major LHBL) should be considered as a major sign of weakness in the longer term view.
As for now, consider the prices of 93-94.5 as a major support level, and assuming that the low of the range continues as being respected, I would give the most chances for more sideways action inside this big range for the next months.
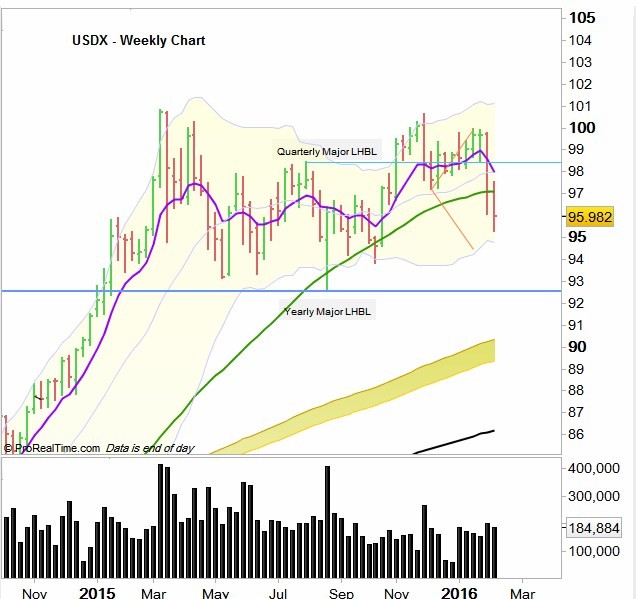
US Dollar Index (USDX) Weekly Chart
Chart2: Weekly chart of the USDX